


What if your application’s hourly revenue figure is the least useful number in an outage review? Revenue loss matters, but it rarely captures the full business impact. Calculating the cost of application downtime also means accounting for lost staff productivity, incident response, recovery work, and downstream effects such as customer churn. A cost-per-hour estimate can look precise while missing what makes an outage costly for your organization.
A defensible estimate starts with your operating data and clearly stated assumptions. This guide shows you how to combine lost business value, operational disruption, and recovery costs without treating uncertain effects as guaranteed losses. You’ll learn to separate measurable direct costs from harder-to-quantify impacts, then use scenarios to see how outage duration and failure type change the result.
The goal isn’t to predict every outage with a single number. It’s to build a transparent model that leadership can scrutinize and use to prioritize resilience work. We’ll cover the core calculation, organization-specific inputs, scenario analysis, and engineering decisions that can address the risks your estimate reveals.
Key Takeaways
- Define downtime by its effect on users and business processes, including degraded service and failed transactions, not only complete outages.
- Separate lost business value, workforce disruption, response and recovery costs, and customer effects so each part of the estimate can be reviewed.
- When calculating the cost of application downtime, use organization-specific evidence and record each input’s source, owner, confidence, and potential overlap.
- Build a transparent estimate from direct impact, incremental response and recovery costs, and downstream effects supported by evidence.
- Use consistent scenarios to rank reliability risks and connect recurring failure modes to targeted engineering improvements.
What Does Application Downtime Cost Include?
Application downtime isn’t limited to a server displaying an error page. It occurs when a service that users or business processes depend on is unavailable or materially degraded. The broader concept of Downtime covers different causes and types. For a business estimate, the key question is whether people can still complete the work the application supports.
A complete outage is the clearest example, but it isn’t the only one. A slow application, failed transactions, delayed data, or an unavailable internal workflow can all disrupt operations. A customer may reach checkout but be unable to pay. An employee may sign in but be unable to process an order. In both cases, the service may be technically running while the task it supports is blocked.
Impact depends on who is affected, which business function is disrupted, when the incident occurs, how long it lasts, and whether a workable alternative exists. The same brief issue can have different consequences during a low-demand period and during a time-sensitive process. Published hourly averages may provide context, but they can’t account for your users, transactions, workarounds, or application’s role. No universal cost-per-hour figure can stand in for a company-specific estimate.
What counts as downtime for a business-critical application?
Set an operational threshold based on service behavior and user impact, not server status alone. Define which response delays, error rates, or failed actions prevent a critical task from being completed. Include transactions that fail outright and those delayed long enough to disrupt the process. Track customer-facing impact separately from internal disruption, so one group’s experience doesn’t obscure the other’s.
For each incident, record the affected function, start and end times, number or type of users affected, and any workaround. These details create a consistent incident boundary, allowing teams to compare similar events instead of treating every performance alert as a full outage.
Why hourly revenue is not the same as downtime cost
Revenue exposed during an incident isn’t automatically revenue permanently lost. Some customers may complete a purchase later; some demand may be abandoned, while some work can be recovered after service returns. Use transaction records, support data, or operational logs to distinguish deferred transactions, abandoned demand, and recoverable work. Don’t count every attempted transaction as a lost sale.
Revenue also leaves out operational impact. An internal application outage may delay work without directly stopping sales, while a customer-facing failure may affect only part of a transaction journey. A single hourly average can mislead decision-makers because it hides which users, business functions, and recoverable activities drive the actual impact.
When calculating the cost of application downtime, start by defining what users couldn’t do and how the disruption affected the business. That scope gives the estimate a sound basis, rather than treating infrastructure availability or gross hourly revenue as a complete measure of loss.
Which Costs Belong in an Application Downtime Estimate?
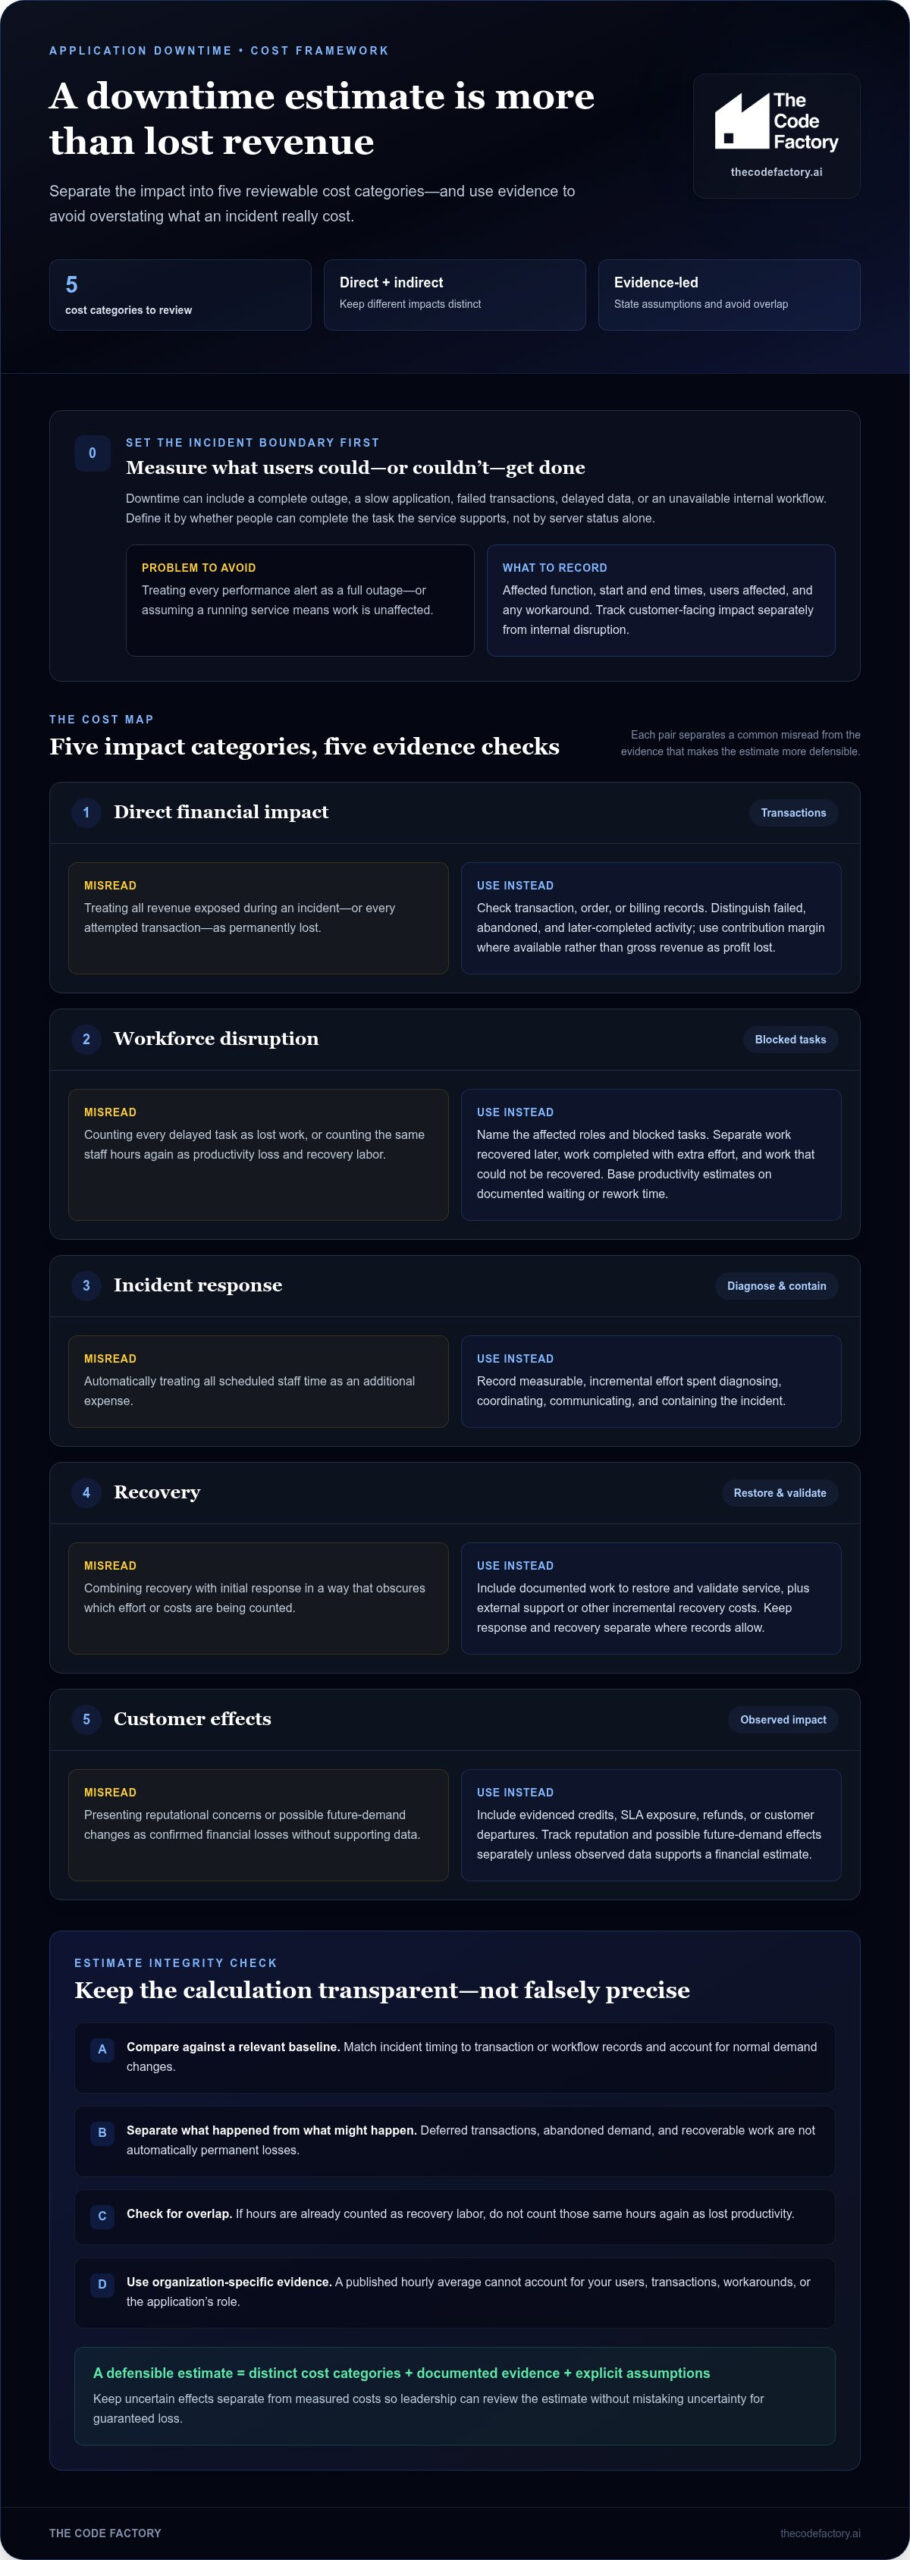
Separate costs by how they arise. This makes assumptions easier for finance and engineering to validate and reduces the risk of presenting one broad figure as a precise loss. For calculating the cost of application downtime, organize the impact into distinct categories:
- Direct financial impact: Estimate transactions that failed or were abandoned during the incident. Use business records and, where available, contribution margin rather than treating gross revenue as profit lost.
- Workforce disruption: Identify which roles couldn’t complete which tasks, how long they were affected, and whether the work was later recovered. Distinguish delayed work from permanently lost work.
- Incident response: Record measurable, incremental effort spent diagnosing, coordinating, communicating, and containing the incident. Don’t automatically count all scheduled staff time as an additional expense.
- Recovery: Include documented work to restore and validate service, along with external support or other incremental recovery costs. Keep recovery effort separate from initial response where records allow.
- Customer effects: Include evidenced credits, service-level agreement exposure, refunds, or customer departures. Track reputational concerns and possible future-demand effects separately unless observed data supports a financial estimate.
Direct losses, delayed work, and employee productivity
Match the incident’s start and end times to transaction, order, billing, or workflow records. Compare affected activity with a relevant baseline, accounting for normal changes in demand, then verify which transactions failed, completed later, or were abandoned. For employee impact, specify affected roles and blocked tasks. Distinguish recoverable work, work completed later at extra effort, and work that couldn’t be recovered. Don’t label every delayed transaction or task a permanent loss.
Productivity estimates need a clear basis, such as documented time spent waiting or redoing work. If those hours are already counted as recovery labor, don’t count them again as lost productivity. State how you treat the time and keep the underlying hours traceable.
Response, recovery, and customer impact
Use incident logs, time records, invoices, and customer-service records to support response and recovery inputs. Count labor as a cost when it represents an incremental expense or a measurable diversion from other work, and distinguish that diversion from payroll already incurred. Include customer credits or churn only when account or contractual evidence connects them to the incident. Keep estimated reputation or future-demand effects outside the observed-loss total.
For each line item, ask what evidence supports it, what period it covers, and whether it overlaps another category. A production readiness review can help identify reliability risks and clarify which failure modes warrant engineering remediation. The result is a cost model leaders can inspect, refine, and use to guide resilience decisions.
How Can You Make the Estimate Credible Without a Universal Benchmark?
A credible estimate reflects how a particular application supports the business. A revenue-based approach is usually more informative when an application directly processes sales or service transactions. A productivity-based approach may better represent internal systems that enable employee work but don’t generate revenue directly. Combining both can help when each captures a distinct impact, but adding them without checking for overlap can inflate the result.
Published averages and competitor survey figures may help frame why downtime deserves attention, but they aren’t a substitute for internal evidence. Before citing a survey, locate the original research and verify its sample, publication date, definition of downtime, and cost scope. A figure based on a different population or on costs your model excludes may not be a useful comparison.
Choose a calculation method that matches the application
For a sales or service application, start with affected transactions during the incident and estimate the contribution margin actually at risk. For an internal system, identify the affected roles and tasks, how much work was delayed or lost, and what evidence supports the time estimate. Combine methods only when their effects are demonstrably separate, such as transaction impact plus distinct employee recovery effort.
Make each input auditable. An evidence register can keep the estimate grounded and expose assumptions before they’re mistaken for measured facts:
| Input | Evidence source | Owner | Confidence | Possible overlap |
|---|---|---|---|---|
| Affected transactions | Order or service records | Business operations | Observed or estimated | Deferred transactions |
| Impacted work | Workflow logs or team review | Department lead | Estimated | Response or recovery hours |
| Response effort | Incident timeline or time records | Incident lead | Observed or estimated | Productivity impact |
| Customer effects | Credit, support, or account records | Customer team | Observed or scenario-based | Future demand or churn |
Document assumptions and prevent double counting
For each incident, record the time window, affected population, evidence source, calculation owner, and whether each input is observed, estimated, or scenario-based. Note potential overlap, especially when staff time appears in both a productivity estimate and an incident or recovery record. If the evidence can’t resolve the overlap, state how you treated it instead of quietly adding both figures.
Use low, expected, and high scenarios when attribution is uncertain. The low case can include only verified impact; the expected case can use the best-supported assumptions; the high case can show plausible additional effects separately. Don’t present the high case as a measured loss.
Transparent assumptions make a downtime estimate more useful than false precision because leaders can challenge, refine, and compare what the number represents. When calculating the cost of application downtime, consistency and traceable evidence matter more than matching a universal benchmark.
How to Calculate Application Downtime Cost Step by Step
A repeatable calculation starts with a defined incident, not a generic hourly rate. Use the same scope, evidence standards, and cost boundaries each time so the result can be reviewed and compared. A transparent formula is:
Downtime cost = direct impact + incremental response and recovery costs + evidenced downstream impact
Direct impact should reflect verified lost contribution or unrecoverable work, rather than automatically treating all affected revenue as lost. Keep each component visible so reviewers can see what was observed, estimated, or excluded.
Gather the incident, service, and business inputs
Before calculating the cost of application downtime, establish the incident window and business scope. Align service telemetry with incident records, then identify affected transactions, teams, customer groups, and workarounds. Collect relevant financial and labor records, support data, and applicable service-level agreement terms. Make sure the inputs describe the same event and time period.
- Define the boundary. Record the application, business function, incident start and end times, and the service behavior that constituted impact. Note whether full restoration occurred before performance returned to an acceptable level.
- Map the impact. Use transaction logs, workflow records, and incident notes to identify activities that failed, were delayed, or continued through a workaround. Separate customer activity from internal work.
- Choose the measurement basis. For transaction-driven applications, calculate the verified effect using relevant transaction records and contribution margin where available. For internal systems, estimate affected work from documented tasks and time. Don’t combine measures that describe the same loss.
- Add incremental costs. Include response and recovery effort only when records support an additional expense or measurable diversion of staff from other work. Add external support costs from relevant records, and avoid counting the same hours in multiple categories.
- Include downstream effects with evidence. Add documented customer credits, contractual exposure, or other attributable effects separately. Keep speculative future demand or reputation impacts outside the observed total, or label them clearly as scenario estimates.
Calculate, review, and preserve the estimate
Apply the chosen method to observed inputs first, then add supported incremental and downstream items. Ask finance and relevant service owners to review the incident window, attribution, assumptions, and possible overlap. If evidence is incomplete, record the uncertainty rather than filling the gap with an unsupported figure.
Save the calculation, source records, definitions, and review notes together. When comparing or aggregating incidents, combine only estimates with compatible scopes, assumptions, and cost categories; otherwise, report them separately. A production readiness review can connect recurring incident evidence to reliability risks and targeted engineering remediation. Review production readiness risks to identify failure modes that may warrant focused engineering work.
Turn Downtime Cost Findings into Engineering Priorities
A downtime estimate is useful when it informs a decision. Use consistent, evidence-based incident estimates to compare systems by business exposure, recovery needs, and uncertainty. A service with frequent disruptions may deserve attention even if each event has limited impact. A rare failure in a critical workflow may also warrant priority if recovery is difficult or the consequences are severe.
Prioritize reliability work by business impact
Compare systems using consistent measures: incident frequency, duration, affected business functions, estimated impact, and confidence in the evidence. Then consider how quickly each service must be restored and how much data the business can tolerate losing. These expectations inform recovery time objectives (RTOs) and recovery point objectives (RPOs). A production readiness review can assess operational risks before they become incidents and help teams evaluate whether recovery plans match business needs.
Rank work by more than the largest estimated loss. Consider whether a failure mode recurs, whether a workaround exists, how uncertain the estimate remains, and whether a focused engineering change could reduce exposure. This makes the prioritization discussion practical: which risk is both consequential and addressable, and what evidence will show whether remediation helped?
Move from a cost model to an engineering plan
Translate recurring incident patterns into reviewable actions. Repeated errors under load may point to a code or scalability constraint; unstable deployments may call for stronger CI/CD controls; recurring configuration failures may indicate cloud infrastructure work. Security-related incidents may warrant hardening. The estimate identifies business exposure, while incident evidence helps pinpoint the control or system change to evaluate.
Where scaling constraints emerge, architecture and scalability consulting can help teams assess the design decisions behind them. Tie each proposed action to a documented failure mode, an owner, and a way to assess its effect, such as tracking whether the same incident pattern recurs. This keeps the cost model from becoming a justification for broad, unfocused investment.
Use the findings to connect business priorities with engineering scope. A production readiness review can surface operational gaps; targeted code remediation, architecture changes, cloud configuration, security hardening, or deployment improvements can then address identified risks. The Code Factory connects engineering findings to focused remediation. Explore The Code Factory’s engineering services to assess which reliability improvements align with your application’s measured exposure.
Revisit the ranking as new incidents and remediation results provide better evidence. The goal isn’t to eliminate uncertainty from every estimate. It’s to make reliability decisions traceable, proportionate to business impact, and specific enough for teams to act on.
Make Reliability a Measurable Business Priority
A downtime estimate should lead to a decision and a way to check whether that decision worked. Set a review point after remediation and compare subsequent incidents using the same measures. If disruption persists, new evidence can help refine the priority instead of leaving the original estimate as a one-time exercise. This turns calculating the cost of application downtime into an ongoing input for resilience planning.
Production readiness reviews and code remediation can help identify and address reliability risks. The Code Factory also provides architecture and scalability consulting, cloud configuration, security hardening, and CI/CD engineering to connect findings with focused technical work.
Explore The Code Factory’s engineering services to identify practical next steps for strengthening application reliability. A clearer view of risk can help your team invest with purpose and build a more resilient foundation.
Frequently Asked Questions
Is application downtime cost the same as lost revenue?
No. Lost revenue is one possible component, but it doesn’t capture every consequence. An internal scheduling application, for example, may delay work without directly interrupting sales. The organization could still face overtime, customer-service effort, or missed operational deadlines. Separate observed financial effects from productivity impacts and estimates of future customer behavior so decision-makers can see what was measured and what remains uncertain.
Can you calculate the cost of partial application downtime?
Yes. Measure the functions affected rather than classifying the entire application as either available or unavailable. For example, compare successful and failed payment attempts, or track how many users could view records but couldn’t submit changes. Service telemetry, transaction logs, and support reports can help identify the affected scope. Record the relevant baseline and incident period, then avoid applying a full-outage assumption to users or workflows that continued normally.
How much historical data do you need to estimate downtime cost?
There’s no fixed minimum. Use the most reliable incident and business records available, ideally covering operating conditions that meaningfully change demand or workload. If the data captures only a quiet period, it may not represent a peak business cycle. With limited history, state that limitation, use documented inputs, and present a range of scenarios rather than implying the estimate is precise.
What happens if an outage has no measurable direct revenue impact?
You can still assess operational impact. Look for delayed internal decisions, manual workarounds, rework, increased support demand, or affected service commitments. For example, a reporting-system failure may postpone a team’s ability to complete a time-sensitive review even if no transaction is lost. Use records to support measurable effects, and keep plausible but unverified consequences separate from the evidence-based estimate.
Should scheduled maintenance count as application downtime?
Include scheduled maintenance when users or business processes lose access or experience material degradation, but classify it separately from unplanned incidents. This distinction helps teams assess total service interruption without confusing planned work with unexpected failure. Track the affected functions, duration, user impact, and additional operational effort. A maintenance window with no meaningful business disruption may be recorded for availability reporting without being treated as a realized business loss.
How often should an organization recalculate its downtime estimate?
Review the estimate when important inputs change, such as application usage, transaction value, staffing patterns, architecture, or recovery procedures. Revisit it after a material incident, using new evidence to test previous assumptions. A regular review during business planning can keep the model current, but the right cadence depends on how quickly the service and its business role change. Preserve prior versions so changes in assumptions remain visible.
