


What if your application is technically available while users can’t complete a transaction? Uptime alone can miss slow requests, failed workflows, and degraded experiences. That’s why application stability metrics need to show more than whether a service is reachable. If your dashboards are crowded but don’t make clear when to investigate, the problem isn’t a lack of data. It’s a lack of context.
This guide explains which signals reveal user-impacting failures and how to interpret them together. You’ll learn how availability, latency, errors, traffic, and resource saturation connect, why trends matter as much as individual alerts, and how to turn findings into service objectives and engineering work. The goal is a focused approach: identify meaningful instability, set thresholds that prompt investigation, and connect persistent issues to practical remediation.
Key Takeaways
- Use application stability metrics to track whether users can complete critical tasks, not just whether the service is online.
- Read availability, latency percentiles, errors, traffic, and saturation together to identify emerging reliability issues.
- Check corroborating signals before drawing conclusions. Averages can hide slow requests and failures on important user journeys.
- Set objectives and alert thresholds around user expectations, historical behavior, and service priorities rather than relying on universal defaults.
- Turn incident findings into prioritized code, architecture, or infrastructure improvements, then verify whether the changes resolved the underlying cause.
What Application Stability Metrics Reveal Beyond Uptime
A service can report as online while users encounter failed payments, stalled searches, or requests that take too long. Uptime answers whether a system is accessible. It doesn’t establish whether the system reliably completes the tasks people depend on.
Application stability metrics indicate whether an application delivers dependable, predictable behavior under expected operating conditions, including completing important user journeys without failures or disruptive delays. They help teams detect partial failures and changing service behavior that a simple availability measure can miss.
How application stability differs from performance and availability
Availability describes whether a service can be reached. Performance describes how quickly it responds and processes work. Stability focuses on whether the service continues to behave reliably as users and systems depend on it. These concepts overlap: a slowdown becomes a stability concern when it disrupts a critical task, while fast responses don’t prove that requests are succeeding.
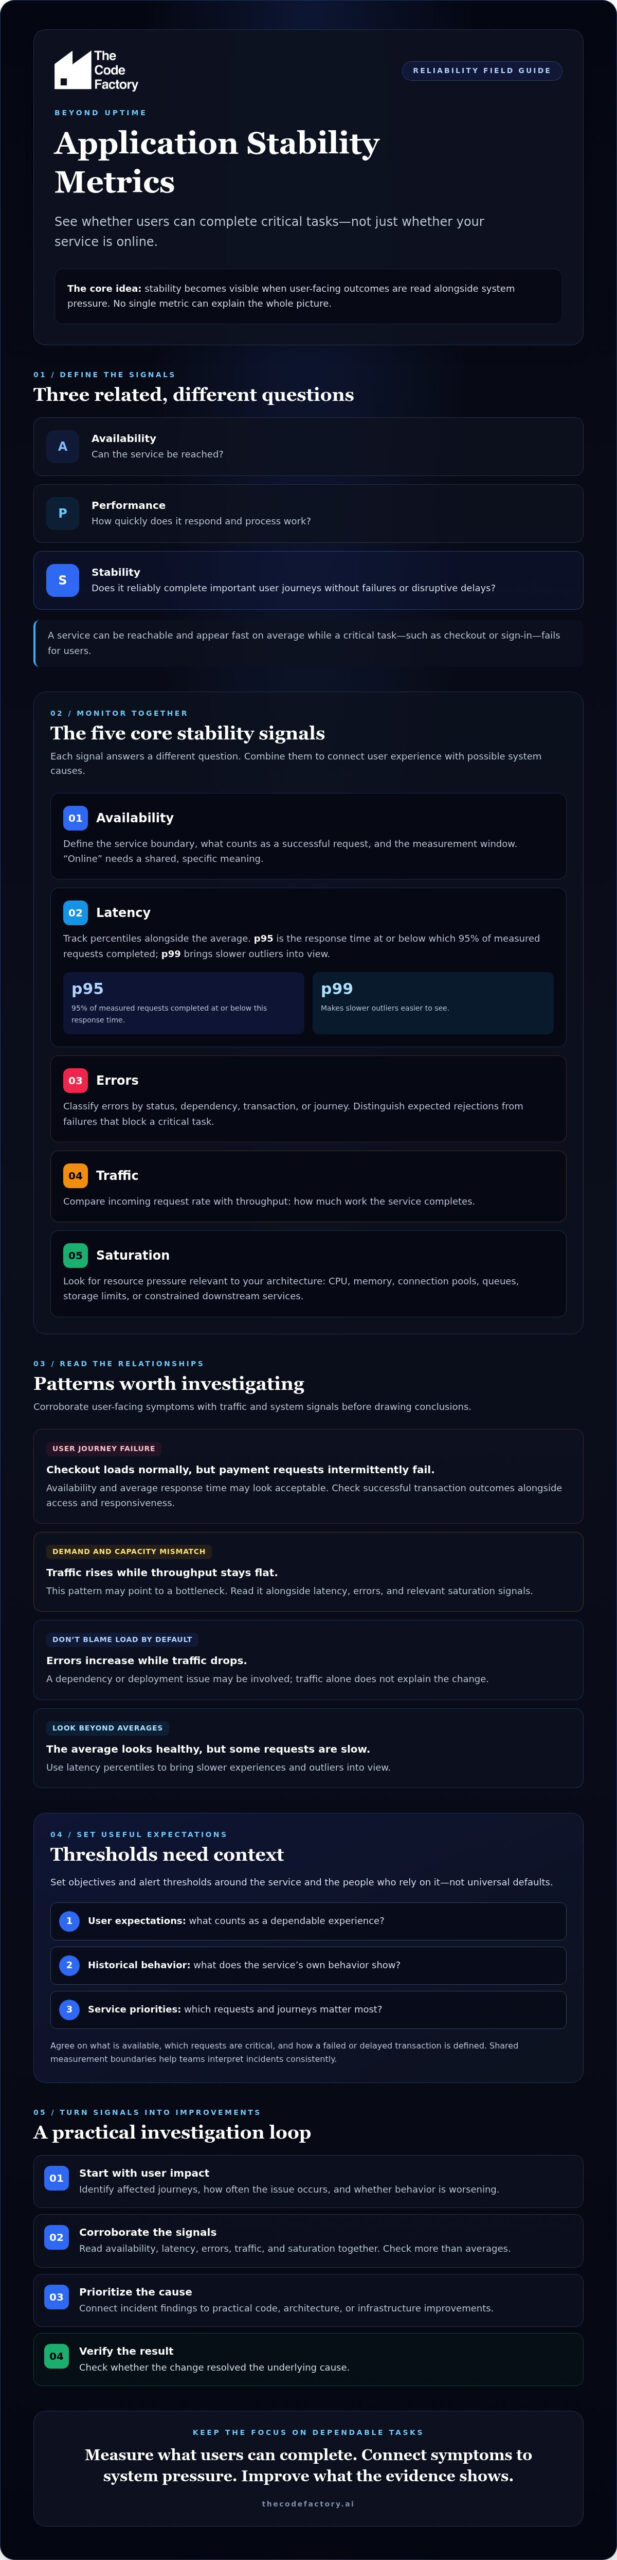
Consider an online checkout that loads normally but intermittently rejects payment requests. The site may be available, and its average response time may look acceptable, yet customers can’t complete a key journey. A stability view checks successful transaction outcomes alongside accessibility and responsiveness.
Measurement boundaries matter. Agree on what counts as available, which requests are critical, and how to define a failed or delayed transaction. Without shared definitions, teams can report different conclusions about the same incident. The discipline of Site Reliability Engineering (SRE) offers a useful foundation for connecting reliability practices with service objectives and operational decisions.
Why stability signals matter to users and engineering teams
Users experience the application as a sequence of tasks, not as a dashboard. A failed sign-in, delayed search, or interrupted payment creates friction even if other parts of the product remain healthy. For engineering and operations teams, the same symptoms may indicate a dependency failure, a resource constraint, or a code path that behaves poorly under expected load.
Consistent signals give product, engineering, and operations teams a shared basis for prioritizing incidents. Instead of debating whether an isolated error “counts,” teams can assess which user journeys are affected, how often the issue occurs, and whether the behavior is worsening. That directs investigation toward failures with the clearest user impact.
Connect technical changes to business outcomes carefully. Where available, use organization-specific evidence, such as support reports or task completion data, rather than assuming every latency increase causes lost revenue. This grounds your definition of stability in how the application is used and gives you a stronger starting point for choosing what to monitor.
The Core Application Stability Metrics to Monitor Together
A useful stability view connects what users experience with the system conditions that may explain it. The core application stability metrics are availability, latency, errors, traffic, and saturation. Each answers a different question, and none provides a complete diagnosis on its own.
Stability emerges from the relationship between user-facing outcomes and system pressure, not from any single metric viewed in isolation.
User-facing signals: availability, latency, and errors
Define availability against a specific service boundary and measurement window. For example, specify which API or user journey is in scope, what qualifies as a successful request, and whether you’re measuring over a minute, an hour, or another agreed period. This makes availability meaningful and comparable instead of an ambiguous “online” status.
Track latency percentiles alongside the average. The p95 shows the response time at or below which 95% of measured requests completed; p99 brings slower outliers into view. An average can appear healthy while a smaller group of users faces long waits. Classify errors by status, dependency, transaction, or journey so teams can distinguish a rejected request that is expected from a failure that blocks a critical task.
System signals: traffic, saturation, and recovery
Request rate shows incoming demand, while throughput shows how much work the service completes. Compare both with latency and errors. Rising traffic with flat throughput may point to a bottleneck, while increasing errors during a traffic drop could indicate a dependency or deployment issue rather than load alone.
Monitor resource saturation in the context of your architecture. CPU and memory pressure matter, as do exhausted connection pools, growing queues, storage limits, and constrained downstream services. The relevant signals depend on how the service is built, so dashboards should expose the constraints that can prevent it from completing work.
For incident response, define detection and recovery boundaries before measuring elapsed time. State what event marks the start, such as the first qualifying alert or confirmed user-impacting failure, and what marks resolution, such as restored successful transactions. Consistent boundaries make incident comparisons more useful.
Apdex can summarize response-time satisfaction, but its thresholds must reflect real user expectations for the task being measured. A threshold suitable for a background report may be unacceptable for an interactive action. Treat Apdex as a supporting indicator, not a replacement for latency percentiles and transaction outcomes.
If persistent saturation or latency points to design or capacity constraints, architecture and scalability consulting can help teams assess the underlying system conditions.
How to Interpret Stability Metrics Without Misleading Yourself
A green uptime dashboard is not proof that an application is stable. It may confirm that a service responds while concealing slow critical requests, intermittent failures, or degradation limited to one dependency. Interpret application stability metrics as related evidence, then verify whether the pattern affects a user-critical action.
Single metrics can point in the wrong direction. Check corroborating signals before deciding whether a service is healthy or an incident needs investigation.
| Misleading conclusion | Signals to check |
|---|---|
| “Availability is green, so users are fine.” | Check successful transaction rates, errors by journey, and latency for critical requests. |
| “Average latency is steady.” | Review p95 or p99 latency and compare affected endpoints. A small group of very slow requests can disappear in the average. |
| “Errors increased, so the release caused it.” | Compare timing with deployment events, traffic changes, dependencies, and the same period in the baseline. |
| “CPU is high, so the service is unstable.” | Check whether latency, queue depth, errors, or throughput also changed. High utilization alone may not mean users are affected. |
Demand varies naturally. Compare current behavior with an appropriate historical baseline, account for expected traffic patterns, and check whether dependencies changed. A release immediately before a metric shift is a useful lead, not proof of cause. Validate the hypothesis against traces, logs, and affected request paths.
Read service-level indicators against service-level objectives
A service-level indicator (SLI) measures observed service behavior, such as the share of successful checkout requests. A service-level objective (SLO) sets a defined target for that indicator over a stated period. Choose objectives around actions users need to complete, not arbitrary dashboard colors or thresholds.
If your team uses an error-budget model, the remaining budget can help guide release and reliability decisions. It’s a planning tool, not a substitute for understanding the incident or its user impact.
Diagnose patterns across latency, errors, and saturation
Rising latency alongside saturated CPU, full connection pools, or growing queues suggests a capacity or resource constraint. Isolated errors with otherwise steady latency and saturation may instead point to a specific request, dependency, or recent code path. These are investigation clues, not automatic diagnoses.
Use traces and logs to follow a metric signal to its source, while keeping clear indicators as the basis for deciding whether service behavior has changed. This helps teams avoid both false reassurance and unnecessary escalation.
How to Choose Thresholds, Alerts, and Dashboards for Stability
Useful alerts start with a clear definition of user impact. Set thresholds based on what users expect, how the service normally behaves, and the objectives your team has chosen, not on a universal default. Apply this workflow to make application stability metrics actionable:
- Define critical journeys. Identify the user actions where failure or delay matters most.
- Select indicators. Choose measures that show success, responsiveness, and relevant system pressure for those journeys.
- Set objectives. Establish target ranges and measurement windows based on user expectations and observed baselines.
- Choose alert behavior. Page for conditions that require urgent response; send less urgent changes to dashboards or investigation queues.
- Review and tune. Compare alerts with incidents, missed signals, and changes in service behavior, then adjust thresholds and ownership.
Build thresholds and alerts teams can act on
Every alert should have an owner, a reason tied to user impact, and a documented first response. A sustained increase in failed requests on a critical journey may justify paging; a brief fluctuation that quickly clears may be better suited to a dashboard. Where appropriate, require a condition to persist or pair it with a corroborating signal to reduce transient noise.
Alert policies need maintenance. Repeated false alarms can create fatigue, while incidents without a corresponding alert reveal gaps in coverage or thresholds. A production readiness review can help assess whether indicators, ownership, and response procedures are clear and supported by the system design.
Design dashboards around service and user journeys
Organize dashboards around a service or critical journey, not an unfiltered inventory of every metric. Place user-facing indicators beside relevant dependencies and infrastructure signals, so an engineer can move from symptom to context. Show trends against a comparison window, mark deployments, and display the related service objective.
Separate views by purpose: an at-a-glance operational dashboard should make current risk clear, while deeper investigation views can expose dependency or resource behavior. If service boundaries and dependencies make measurement difficult, consider the system design through software architecture consulting. Clear ownership and boundaries make it easier to select meaningful indicators and route alerts to the right team.
For help assessing whether stability measures and operational practices are ready for production, production readiness review support can be a useful next step.
Turn Application Stability Metrics Into Engineering Improvements
Metrics become valuable when they change what the team does next. An alert can identify a shift in latency or failed requests, but incident review must establish where the failure began and what will prevent it from recurring. Use the evidence to prioritize code remediation, architecture changes, or infrastructure work according to user impact and risk, rather than treating every dashboard fluctuation as equally urgent.
Move from a metric alert to verified remediation
Start with the affected request or user journey. Follow its traces through dependencies, compare behavior before and after recent releases, and check for related infrastructure changes. Then record a working hypothesis, the corrective action, an owner, and how the team will verify the result. This creates a clear path from signal to accountable engineering work.
Distinguish symptom relief from durable remediation. Restarting a service may restore normal behavior, but it doesn’t establish why a queue grew or a dependency timed out. After a code, architecture, or infrastructure change, compare the same relevant indicators against the prior baseline. Confirm that the user-facing issue improved without creating new errors or pressure elsewhere.
Look for patterns across incidents. Repeated saturation after releases, recurring failures in the same dependency, or frequent manual recovery may point to a design weakness or a delivery-process gap. For code-level findings, teams can also assess whether AI-assisted code remediation is appropriate, while validating proposed changes through review and testing.
When an independent production assessment can help
Recurring incidents, unclear ownership, and objectives that teams can’t reliably measure are signs that the issue may extend beyond one defect. A production readiness review can examine whether metrics are actionable and whether code, architecture, infrastructure, and operational practices support the reliability the service requires. Findings can inform focused remediation rather than another round of temporary fixes.
The Code Factory offers production readiness reviews, code remediation and optimisation, architecture and scalability consulting, and cloud infrastructure configuration for teams translating stability findings into production improvements. A focused review can help clarify which problems need immediate correction and which call for deeper engineering work.
Discuss a production stability review to assess whether your measurements and remediation priorities are aligned.
Make Reliability a Deliberate Engineering Practice
Reliable software requires more than a green uptime indicator. A focused set of application stability metrics helps teams see whether critical journeys are working, interpret service behavior in context, and set alert thresholds that prompt useful action. Progress comes when incident findings lead to prioritized changes and teams verify that those changes address the underlying cause.
If recurring failures, unclear ownership, or hard-to-measure objectives are holding back reliability, an independent assessment can help identify where engineering effort matters most. The Code Factory provides production readiness reviews and code remediation, alongside architecture and scalability consulting, cloud configuration, and security hardening.
To assess your measurements and remediation priorities, discuss your application stability and production readiness needs with The Code Factory.
Frequently Asked Questions
What are application stability metrics?
Application stability metrics indicate whether an application behaves dependably and predictably under expected conditions. They show more than uptime, which only indicates whether a service is accessible. Stability also considers performance, or responsiveness, and whether requests complete successfully. Common measures include availability, latency, errors, and saturation. The right set depends on the user-critical journeys being measured and clearly defined service boundaries.
Which metrics are most important for application stability?
Start with availability, latency percentiles, user-impacting error rate, traffic, and saturation. There’s no universal metric list for every service: an interactive application and a background processing system may have different reliability concerns. Pair user-facing indicators, such as successful task completion and response time, with relevant system context, including resource constraints. Define service objectives for the behaviors users depend on so measurements support clear decisions.
Is uptime enough to measure application stability?
No. Uptime can show that a service is reachable while missing slow responses, partial failures, or broken user journeys. Availability measures whether a defined service can be accessed; responsiveness describes how quickly it works, while correctness asks whether it completes the intended task. Evaluate uptime alongside latency, errors, and transaction-level behavior. Specify the service boundary and measurement window so the results describe a meaningful view of user experience.
How do I set application stability metric thresholds?
Set thresholds using user expectations, service-level indicators, service-level objectives, and observed historical baselines. Avoid treating one threshold as suitable for every application or journey. For each alert, identify an owner and document the user impact and first response. Use sustained conditions where appropriate to limit transient noise. Review incidents, missed signals, and alert fatigue regularly, then tune thresholds so they prompt investigation when service behavior meaningfully changes.
What is the difference between an SLI and an SLO?
An SLI, or service-level indicator, measures observed service behavior. An SLO, or service-level objective, defines a target for that measurement over a specified period. For example, a team might measure the share of successful requests to a critical service as its SLI, then set a target for that share as its SLO. Define the measurement boundary and choose objectives around the service behavior users rely on.
How can I tell whether high latency is an application stability problem?
Check whether high latency affects a sustained share of important requests or a critical user journey, then compare percentiles with errors, request volume, saturation, dependencies, and recent releases. A few isolated slow requests may not indicate broad instability, but persistent delays alongside rising failures or resource pressure deserve investigation. Use traces and logs to follow a meaningful metric pattern to its source; they complement, rather than replace, clear indicators.
When should a company review its application stability metrics?
Review metrics after significant architecture, traffic, dependency, or release changes, and when analyzing recurring incidents. User journeys and service conditions evolve, so objectives, alert thresholds, and ownership may need adjustment too. If teams can’t interpret persistent signals, agree on what they mean, or turn them into remediation, consider an independent production readiness review. It can help assess whether measurement practices and system design support actionable reliability decisions.
