



Your application’s speed is not a luxury; it’s the structural foundation of your brand’s integrity. Most performance issues aren’t caused by a single line of bad code. Instead, they’re the result of architectural fragility that collapses under the weight of real-world scale. You’ve likely felt the anxiety of an unpredictable latency spike during peak traffic or realized that your AI-generated prototype is hemorrhaging cloud budget. It’s a common frustration for leaders who value stability over hype. Successfully resolving application performance bottlenecks requires more than just reactive patching. It demands a disciplined, architectural approach that prioritizes long-term maintenance over temporary fixes.
We understand that the transition from a fast-moving experimental phase to a hardened production environment is fraught with risk. This article provides the engineering protocols you need to identify, diagnose, and remediate constraints in high-stakes environments. You’ll learn how to meet the 2026 thresholds for Core Web Vitals, including an Interaction to Next Paint (INP) under 200 milliseconds, while reducing operational risk. We’ll walk through a comprehensive hardening checklist designed to streamline your infrastructure, eliminate technical debt, and ensure a stable, scalable production environment that delivers a clear ROI on every remediation effort.
Key Takeaways
- Modern performance constraints have shifted from simple CPU spikes to complex distributed contention. Learn how to identify these invisible structural failures before they impact your users.
- Shift your strategy from reactive patching to a disciplined production readiness culture. We outline the essential architectural hardening steps required to verify system integrity before launch.
- Move beyond surface-level monitoring by implementing deep observability. Master the hierarchy of diagnostic protocols, including logging, metrics, and distributed tracing, to pinpoint root causes.
- Follow a systematic four-step framework for resolving application performance bottlenecks. This structured approach helps you isolate, analyze, refactor, and verify fixes to ensure long-term stability.
- Discover why a formal Production Readiness Review is the ultimate defense against technical debt. Establishing these engineering protocols ensures your application can scale reliably under peak traffic.
Defining the Enterprise Performance Bottleneck in 2026
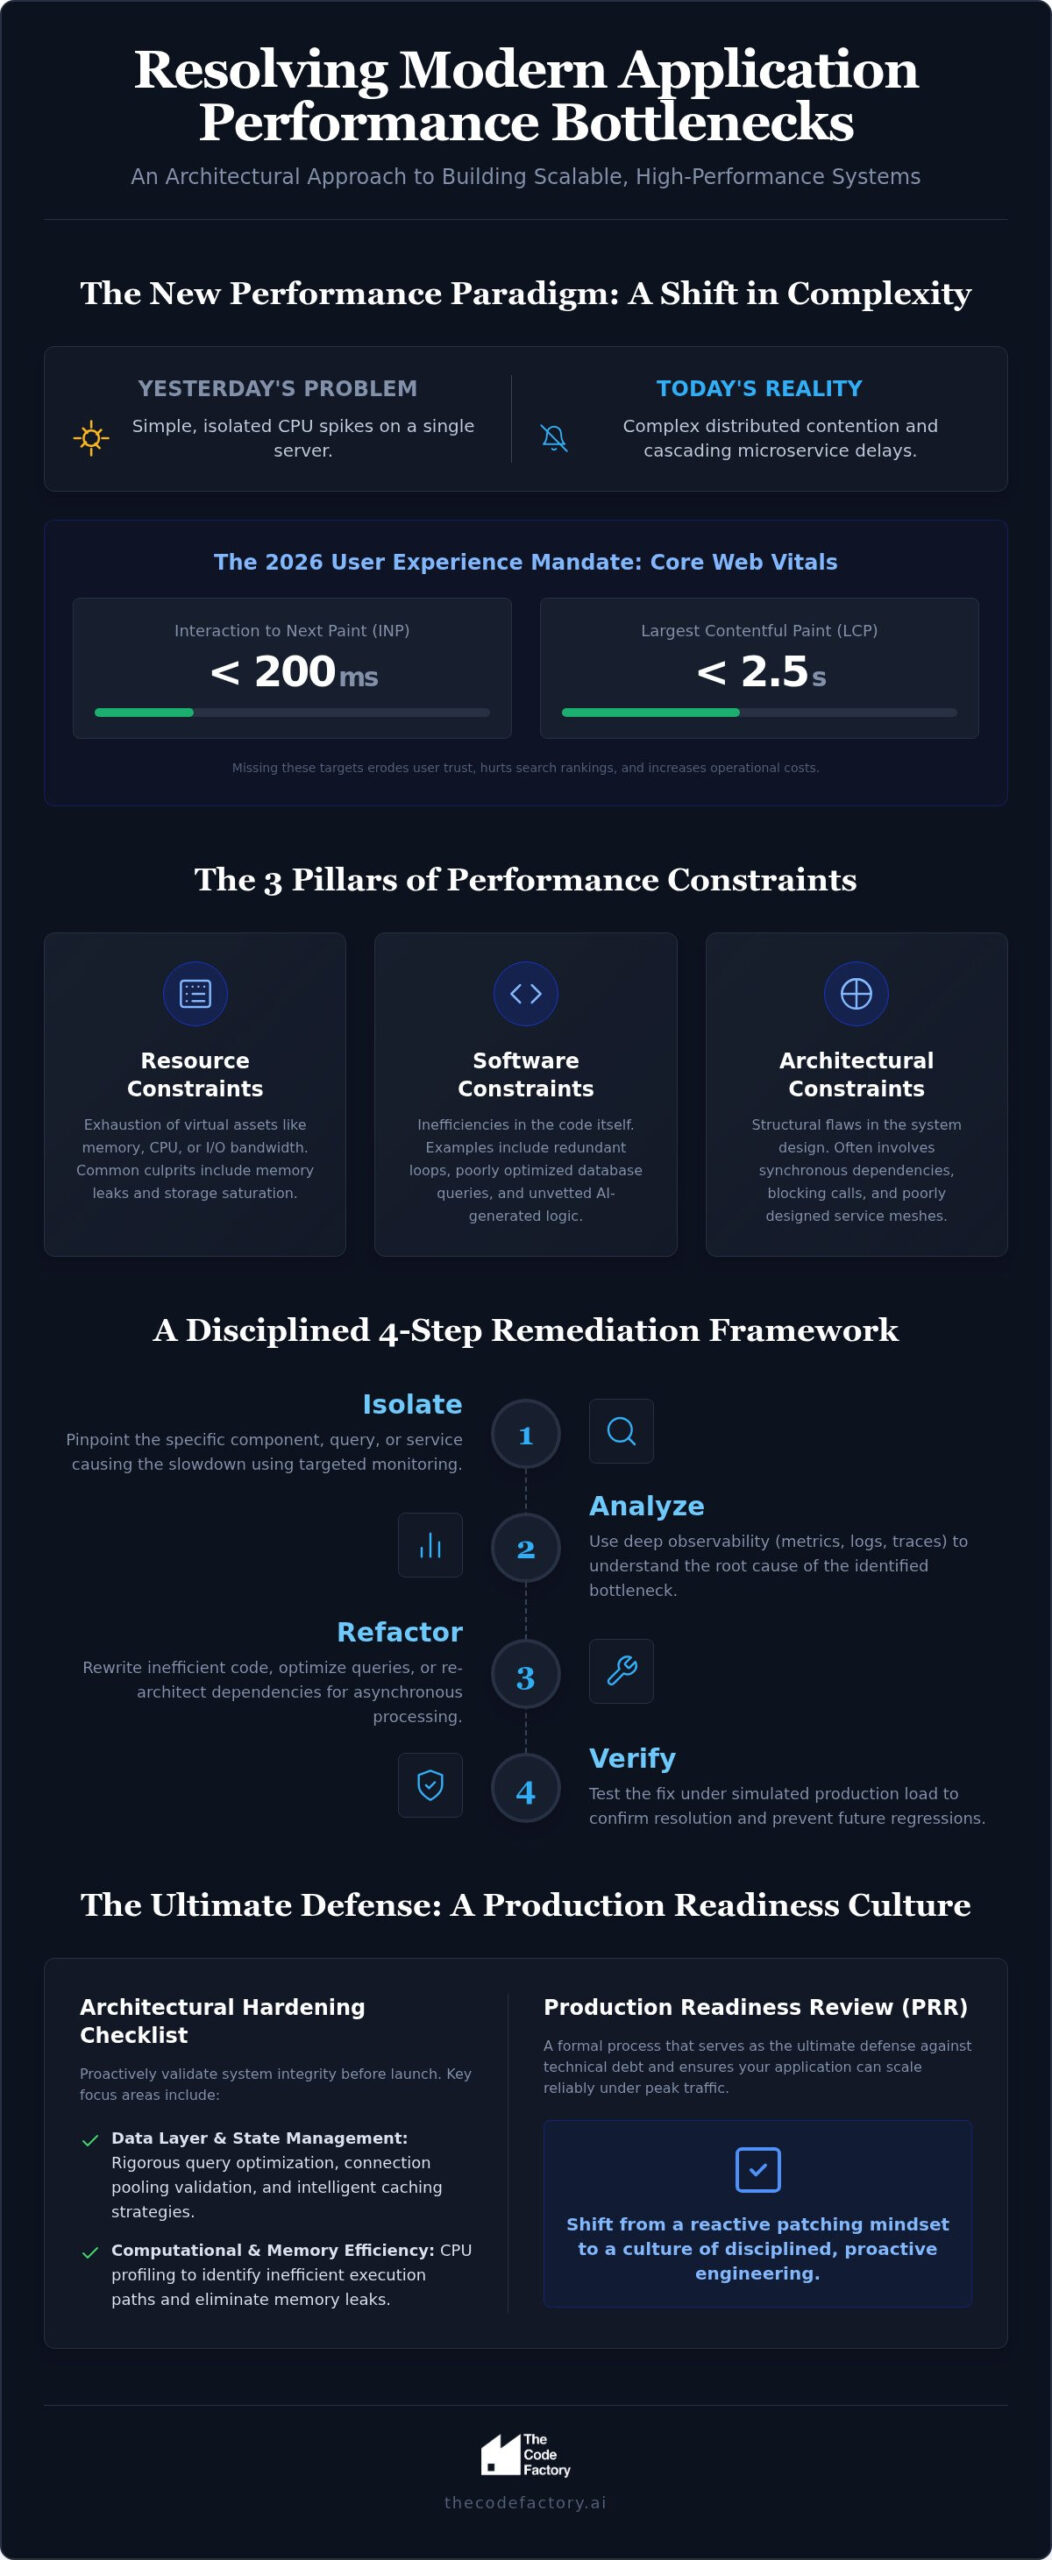
The nature of system failure has evolved. In the past, a performance issue was often as simple as a single server reaching its CPU limit. In 2026, the challenge is far more insidious. Modern systems suffer from distributed contention, where small delays in microservices cascade into systemic failures. Successfully resolving application performance bottlenecks requires moving past the simplistic analogies used by generalists. It requires a deep understanding of how data flows through a complex, cloud-native architecture. In the context of modern microservices, a performance bottleneck is any structural point where the systemic flow of execution is restricted by the slowest component, causing cumulative latency that violates service-level objectives.
This is no longer just a technical annoyance; it’s a fundamental software bottleneck that compromises the entire stack. We categorize these constraints into three distinct pillars to help teams organize their remediation efforts. Resource constraints involve the exhaustion of virtual assets, such as memory leaks or I/O saturation. Software constraints stem from inefficient code, redundant loops, or poorly managed database queries. Finally, architectural constraints represent structural flaws in the service mesh, such as synchronous dependencies that create blocking calls and prevent horizontal scaling.
The Cost of Indecision: Revenue and Reputation
Latency is a direct liability for enterprise revenue. As of 2026, Google’s Core Web Vitals have set strict thresholds for user experience: Largest Contentful Paint (LCP) must stay under 2.5 seconds, and Interaction to Next Paint (INP) must remain under 200 milliseconds. Missing these targets doesn’t just hurt search rankings; it erodes user trust and increases churn. Every millisecond of delay acts as a performance tax on your cloud infrastructure, driving up operational costs without adding business value. When systems lag, users leave, and the cost of remediation only grows as technical debt accumulates.
AI-Generated Code: The New Performance Frontier
The rise of AI-assisted development has introduced a new class of performance risks. While “vibe coding” allows for rapid prototyping, it often produces unoptimized and redundant logic that developers fail to vet properly. These AI-generated blocks can include unnecessary libraries or inefficient algorithms that function in a sandbox but fail under production load. Transitioning from an experimental prototype to enterprise-grade reliability requires a sober review of every logic gate. Without resolving application performance bottlenecks introduced by automated tools, you risk deploying fragile systems that are impossible to maintain in high-stakes environments.
The Architectural Hardening Checklist: Pre-Production Essentials
Production readiness is not a final checkbox on a Jira ticket; it’s a disciplined engineering culture. Waiting until a system is under load to discover its breaking point is a high-stakes gamble that enterprise leaders can’t afford. To succeed in resolving application performance bottlenecks, teams must move from reactive patching to proactive architectural hardening. This transition ensures that every component, from the database to the edge, is built for enterprise-level performance before the first real user arrives.
Data Layer and State Management
The database is frequently the primary source of distributed contention. A robust hardening process must include a rigorous verification of query optimization and indexing strategies. Developers often overlook the limits of connection pooling, leading to exhaustion during traffic surges. To maintain stability, teams should evaluate caching strategies using tools like Redis or Memcached, specifically focusing on how stateful applications handle high-concurrency scenarios without compromising data consistency.
Computational and Memory Efficiency
Code that functions in a development environment can fail catastrophically in production due to memory leaks or inefficient execution paths. CPU profiling is essential for identifying high-frequency paths that consume disproportionate resources. This is particularly critical when dealing with AI-generated code. While “vibe coding” speeds up initial creation, it often introduces redundant logic and algorithmic complexity that automated tools fail to optimize. A formal production readiness review is necessary to vet AI-remediated code for structural integrity and long-term scalability.
Network and Infrastructure Configuration
Infrastructure settings are often the silent killers of throughput. Cloud security configurations, while necessary, can introduce significant overhead if they aren’t properly tuned for the specific traffic patterns of your application. Optimizing load balancer health checks prevents healthy nodes from being prematurely removed from rotation during minor fluctuations. Additionally, teams must account for CDN edge-case handling to ensure that cached assets don’t serve stale data or bypass the cache during critical peak periods. Hardening these layers ensures that resolving application performance bottlenecks becomes a systematic process rather than a desperate fire drill.
Diagnostic Protocols: Identifying Invisible Constraints
Identifying a failure is simple; diagnosing its root cause in a distributed environment is where most engineering teams struggle. Surface-level monitoring might tell you that a service is down, but it rarely explains why. To move toward resolving application performance bottlenecks, you must implement deep observability. This transition requires a structured hierarchy of diagnostics that balances immediate visibility with long-term forensic capabilities. Distributed tracing is the method of tracking a single request as it traverses multiple microservices, providing the visibility required to map complex dependencies in 2026 architectures. Without this granular view, your backend infrastructure remains a “black box” where performance gains in one area are offset by invisible delays in another.
A balanced diagnostic strategy utilizes both synthetic testing and real user monitoring (RUM). Synthetic testing allows you to verify baseline performance in a controlled environment, while RUM captures the chaotic reality of actual network conditions and device variability. By correlating these data points, you can identify whether a constraint is systemic or isolated to specific user segments. This dual approach is essential for maintaining the high-stakes production environments that enterprise clients demand.
Observability as a Strategic Asset
Observability should be treated as a core architectural pillar rather than an operational afterthought. Effective teams deploy comprehensive dashboards that correlate business KPIs, such as conversion rates, with technical metrics like p99 latency. This alignment ensures that engineering efforts remain focused on outcomes that matter. To maintain this focus, you must establish sober alerting thresholds. Notification fatigue is a significant risk; if your team is bombarded by low-priority alerts, they will eventually miss the critical signals that precede a major outage. Utilizing Infrastructure as Code (IaC) ensures that these diagnostic and security hardening configurations remain consistent across all environments, preventing performance-sapping misconfigurations during scaling.
Simulating Peak Stress: The Load Testing Protocol
Standard load tests often fail because they don’t account for “black swan” events or the performance overhead of security hardening protocols under extreme load. A rigorous protocol must distinguish between stress testing, which finds the immediate breaking point, and soak testing, which evaluates how a system performs under sustained load over several days. Soak testing is particularly effective at uncovering memory leaks and resource exhaustion that shorter tests miss. Automating these monitoring tasks within your CI/CD deployment pipelines ensures that performance regressions are caught before they reach production. This proactive approach is the only way to ensure resolving application performance bottlenecks becomes a repeatable engineering discipline rather than a series of emergency responses.
Remediation Framework: From Identification to Resolution
Identification is merely the prelude to the rigorous work of restoration. Without a systematic framework, efforts to fix performance often become a game of “whack-a-mole” where one patch inadvertently triggers a failure elsewhere. Resolving application performance bottlenecks requires a disciplined four-step cycle: Isolate, Analyze, Refactor, and Verify. This structured approach ensures that every intervention is grounded in empirical data rather than developer intuition. Efficiency dictates that we prioritize fixes based on the “80/20 rule,” focusing on the 20% of code paths responsible for 80% of systemic latency. This pragmatic focus allows for rapid remediation without compromising the security hardening or structural stability of the high-stakes production environment.
Isolation and Root Cause Analysis (RCA)
Generic troubleshooting often fails to account for the interplay between services in a complex microservices mesh. A structured isolation protocol ensures that the root cause is trapped before resources are wasted on superficial fixes. We utilize flame graphs and thread dumps to pinpoint specific code-level friction, such as lock contention or inefficient garbage collection. It’s critical to differentiate between transient network issues, which may require infrastructure tuning, and persistent code debt that requires deeper intervention. If your team is struggling with deep-seated technical debt, our code remediation and optimisation services provide the surgical precision needed to restore system integrity.
Refactoring for Scalability
Strategic code remediation involves a sober assessment of technical debt: you must decide when to apply a targeted patch and when a full architectural rewrite is necessary. This decision is particularly vital when dealing with unoptimized AI-generated logic that lacks the rigor of traditional engineering. Once a refactor is complete, optimizing your CI/CD pipelines is the next logical step to ensure that performance fixes don’t introduce regressions in future deployments. Leveraging specialized architecture and scalability consulting allows organizations to implement high-impact structural changes that go beyond simple code fixes. This final stage of the framework ensures that resolving application performance bottlenecks results in a hardened, future-proof system capable of handling peak traffic without the risk of collapse.
Implementing a Production Readiness Culture
Performance is an engineering discipline, not a post-launch luxury. Many organizations mistake speed of initial delivery for long-term success, only to find their systems buckling under real-world pressure. Transforming a prototype into an enterprise-grade system requires more than just functional code; it requires a culture of production readiness. A formal Production Readiness Review serves as the ultimate gatekeeper, ensuring that technical debt is identified and neutralized before it reaches your users. While internal teams are excellent at creation, they often benefit from an independent engineering audit. This “sober voice of reason” provides the foresight needed to prevent outages at scale, ensuring that resolving application performance bottlenecks is a proactive strategy rather than a reactive crisis.
At The Code Factory, we specialize in this transition. We help leaders move from the experimental speed of “vibe coding” to the structural integrity required for high-stakes environments. By implementing a disciplined protocol, we turn fragile prototypes into hardened, scalable systems that can withstand peak traffic without compromising security or reliability.
The ROI of Technical Debt Remediation
Proactive performance hardening is a financial imperative. Inefficient code doesn’t just slow down your users; it directly inflates your operational costs by wasting cloud resources. As observability platforms like Datadog and New Relic continue to utilize complex pricing models based on data ingestion and host counts, unoptimized systems become a significant drain on your budget. Investing in Technical Debt Remediation provides a clear return on investment by reducing infrastructure overhead and lowering the cost of scaling. When your code is streamlined, you pay for performance, not for redundancy.
The Final Protocol: Your Roadmap to Stability
Establishing a stable production environment requires a regular cadence of software scalability audits. You can’t rely on a “set it and forget it” mentality in an era where AI-assisted development can introduce unvetted logic into your pipelines at an unprecedented rate. Teams must adopt a “Performance First” mindset, treating efficiency as a core requirement of every pull request. This cultural shift ensures that resolving application performance bottlenecks becomes a natural part of the development lifecycle. By prioritizing the rigor of traditional engineering over the hype of rapid prototyping, you protect your reputation and your revenue. Secure your production launch with a Production Readiness Review today to ensure your architecture is truly built for the demands of 2026.
Securing Your Architectural Integrity for 2026 and Beyond
The journey from an experimental prototype to a resilient, enterprise-grade system requires a fundamental shift in perspective. It’s not enough to build fast; you must build for stability. By implementing the diagnostic protocols and systematic remediation frameworks discussed, you move beyond temporary fixes to a state of permanent architectural integrity. Successfully resolving application performance bottlenecks is the result of a disciplined engineering culture that values long-term maintenance over short-term speed. This transition ensures your infrastructure isn’t just functional, but truly hardened against the unpredictable demands of peak traffic.
As an independent engineering consultancy with deep expertise in high-stakes production environments, we provide the sober voice of reason your team needs to scale securely. We specialize in AI code remediation and technical debt optimization, helping you navigate the complexities of modern microservices with surgical precision. Book a Production Readiness Review with The Code Factory to ensure your next launch is defined by stability rather than latency. Your path to a scalable, high-performance future starts with a single, disciplined step.
Frequently Asked Questions
What are the most common causes of application performance bottlenecks?
Common causes include inefficient database queries, unoptimized code logic, resource exhaustion, and network latency within microservices. Often, these issues stem from architectural fragility rather than a single line of code. Distributed contention and blocking synchronous calls are frequent culprits in modern cloud environments. Addressing these requires a systematic approach to identifying and hardening the specific layer where the restriction occurs to ensure long-term stability.
How do I identify a bottleneck in a microservices architecture?
Identification requires deep observability through distributed tracing, logging, and metrics. You must track requests as they traverse multiple services to find where cumulative latency spikes occur. Synthetic testing helps establish baselines, while real user monitoring captures performance under actual network conditions. Correlating these data points allows you to pinpoint whether a bottleneck is isolated to a specific service or is the result of a systemic architectural flaw in the mesh.
Can AI-generated code cause performance issues in production?
Yes, AI-generated code often introduces performance issues because it lacks the optimization and rigor of traditional engineering. “Vibe coding” can lead to redundant logic, inefficient algorithms, and unvetted libraries that fail under production loads. These tools focus on functional speed rather than structural integrity. Successfully resolving application performance bottlenecks in AI-assisted projects requires a formal review to refactor unoptimized logic and remove technical debt before the system is exposed to peak traffic.
What is the difference between load testing and stress testing?
Load testing evaluates how a system performs under expected peak traffic to ensure it meets service-level objectives. In contrast, stress testing pushes the system beyond its limits to find the point of catastrophic failure. While load testing verifies capacity, stress testing identifies how the system recovers from “black swan” events. Both are essential components of a disciplined architectural hardening protocol designed to mitigate operational risk during high-traffic periods.
How much does technical debt impact application scalability?
Technical debt significantly limits scalability by creating friction that compounds as traffic grows. Unoptimized code and legacy architectural shortcuts act as a performance tax on your cloud infrastructure, driving up operational costs without adding value. Proactive remediation is necessary because debt often manifests as unpredictable latency spikes during peak periods. High-stakes environments cannot afford the risk of scaling a fragile system that hasn’t been properly hardened against real-world production demands.
What is a Production Readiness Review, and why is it necessary?
A Production Readiness Review is a formal engineering audit that verifies a system’s integrity, security, and scalability before it goes live. It’s necessary because it identifies hidden risks and technical debt that internal teams might overlook during rapid development. By serving as a strategic gatekeeper, this review ensures that every component is built for enterprise-grade reliability and can withstand the stress of a high-stakes production environment safely.
How can CI/CD pipelines help resolve performance bottlenecks?
CI/CD pipelines help by automating performance monitoring and catching regressions before they reach production. By integrating load tests and CPU profiling into the deployment cycle, you ensure that new code doesn’t degrade existing throughput. This automated feedback loop is critical for resolving application performance bottlenecks early in the development lifecycle. It transforms performance from a post-launch fire drill into a repeatable engineering discipline that supports long-term system stability and growth.
When should I hire a technical architecture consultant for performance issues?
You should hire a technical architecture consultant when your internal team struggles with persistent latency spikes or complex distributed contention that resists standard fixes. A “sober voice of reason” provides an independent audit of your architecture, identifying structural flaws that are invisible from the inside. Specialized fixers bring the foresight needed to prevent outages at scale, especially when transitioning from experimental prototypes to hardened production systems that require end-to-end architecture and scalability consulting.